Conning – a Hartford-based asset manager with over $140 billion AUM – issued its “State of the States” (SOTS) credit research report today. The report is available free at http://bit.ly/Conning2019.
2019 marked the ten year anniversary of the Great Recession, thus from both a narrative and analytical viewpoint, a comparison of the key economic indicators for the 50 states provides a snapshot at how the U.S. economy has changed. And with the economy goes credit quality – an issue close to the hearts of municipal bonds investors and professionals.
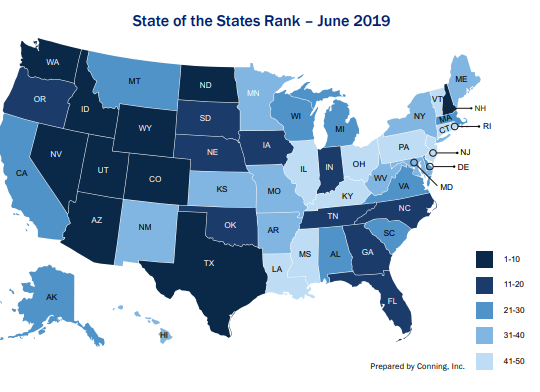
The SOTS report uses thirteen credit indicators to compare state credit quality and assign a ranking from #1 to #50. Credit-related metrics included debt/personal income, tax revenue growth and fund balances. Economic measures included GDP, employment, household income, population and home price growth.
Let’s start with the headlines – which states did well and which states did badly? The Top Five States in 2019 are Utah, Nevada, Idaho, Colorado and North Dakota. All five experienced strong economic growth and low unemployment. Debt was moderate to low relative to East Coast blue states. The Bottom Five are a mix of industrial states (Rhode Island and Connecticut) and states in the South – Mississippi, Louisiana and Kentucky – all of which had sluggish economies and housing markets.
In comparing states’ performance over ten years, some general stalwarts remained – Texas, Wyoming, Washington, North and South Dakotas all maintained Top 10 rankings over the decade. The most improved states were New Hampshire (#37 to #7), Nevada (#29 to #2) and Utah (#22 to #1).

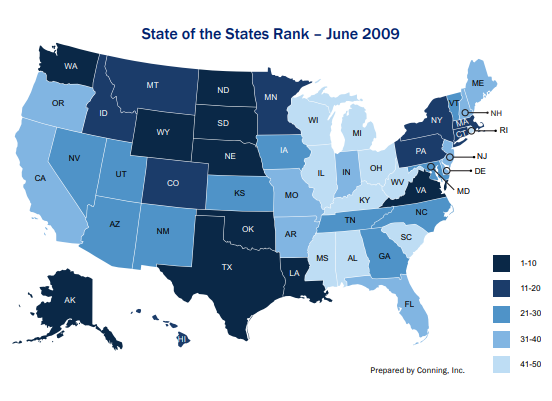
The impact of housing was an important conclusion. States that have dramatically improved their rankings between 2019 and 2009 have correspondingly improved housing markets – California (+9 change), Florida (+21 change) and Nevada (+27 change). States with tepid housing recovery experienced flailing economies – Connecticut, Pennsylvania and Louisiana.
While the study also covered liquidity and balance sheet ratios, this reporter concluded that these metrics were far less important in terms of determining the overall prosperity of states. For example, California had one of the highest fixed costs (pensions and debt in the main) as a % of General Fund budgets, with nary an impact on the State’s perceived credit quality. Conversely, states like Nebraska and Wisconsin had very low fixed costs but middle-of-the-pack overall rankings. This makes sense – what you save matters but what you EARN is by far the largest variable in determining your lifetime net worth.
The Conning Report tells us which states have or have not improved – but it doesn’t go into the details on how specific states have achieved greater fiscal strengths. Here’s my take and it comes in a graphic format.
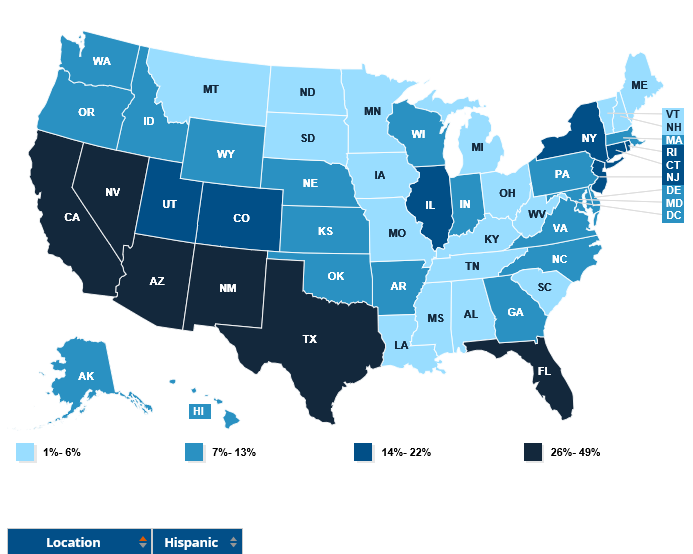
Did I just copy-pasted the same chart, you say? Not exactly. What you are seeing here is the Kauffman Foundation’s analysis on the composition of HISPANIC residents in the fifty states based on Census Data updated for 2017.
So what’s happening here? There’s plenty of think-tank pieces in the public domain which you are welcome to peruse. But in a nutshell:
- Hispanics remain a young demographic group relative to the rest of the U.S. population. Young workers consume less governmental services but contribute taxes and labor to the economy
- Kauffman Foundation studies indicated that since the early 2000s, the Hispanic community has exhibited significantly higher small-business entrepreneurship than Whites, African Americans and Asian Americans
- In Western states, Hispanics are driving entrepreneurship in key sectors including building and construction, retail and food/beverage.
- Hispanics have lower educational attainments and are historically underrepresented in media and entertainment but this trend is slowly shifting, broadening Hispanic participation in non-traditional sectors
- Home ownership among Hispanics remains low, but presents a large growth area in states with large Hispanic populations (New Mexico, Texas, California, Arizona and Nevada)
We say in our #BuyMuni brainstorming sessions that municipal credit is like the Titanic – it turns slowly and shifts in inches every year.
Corporate America has talked about the “Hispanic Wave” for over a decade. But the transition has been so gradual that for beltway financial analysts located in New York City, San Francisco – and Hartford! – the full economic impact stemming from the Hispanic Wave may not have been apparent.
But the wave has arrived. And it’s time the municipal finance industry took notice.
Bienvenidos!
#Muniland #MunicipalBonds #Conning #States #CreditQuality
Contact Lisa Lopez at LP@BuyMuni.com


As the creator of Conning’s state of the states report and author for the previous 11 years I appreciate your comments. The Hispanic wave is reflected In the indicators used. Conning’s top states have younger populations than the nation as a whole. Utah as opposed to Maine. We measure population growth, but not its changing composition. This is an interesting theme that merits a separate study.